
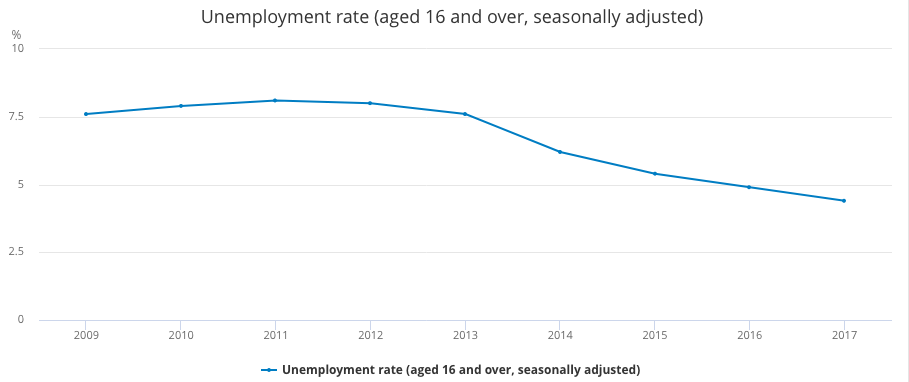
In amongst the current hoo-hah in UK parliament regarding the EU exit, the government has been more than eager to restate the unemployment statistics to an opposition that has built its claim on helping improve conditions for workers. This is because unemployment has been on a fairly consistent downward trend since around 2012.
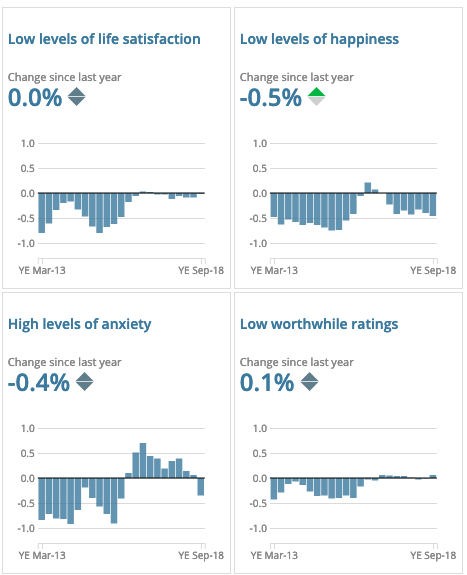
Reducing unemployment has long been a target of governments, and it seems for good reason, as modern economic research has cemented the negative effects of unemployment on overall subjective well-being (e.g. people’s satisfaction with their lives). So why is it still the case that people claim to be struggling financially, or that people are not considerably happier? The graphs below show how well-being has changed year on year. It seems that even though more people are working, there has barely been any change in the past few years in how many people have low levels of life satisfaction or worthwhileness with their lives. And, apart from the previous year, there seems to have been an increase in people with high levels of anxiety.
Perhaps unemployment doesn’t tell the whole story. The problem is, having a statistic that tells you that someone now has a job doesn’t tell you how much they enjoy that job, what the ‘quality’ of that job is, what the conditions in that job are, whether they can support themselves comfortably with that job, and so on. Just a quick example of what I mean. The graph below shows job satisfaction data from Eurostat in 2017. It’s a crude measure – there are just three levels. You can either have high (green), medium (yellow), or low (red) job satisfaction. In this respect, the UK is decidedly average.
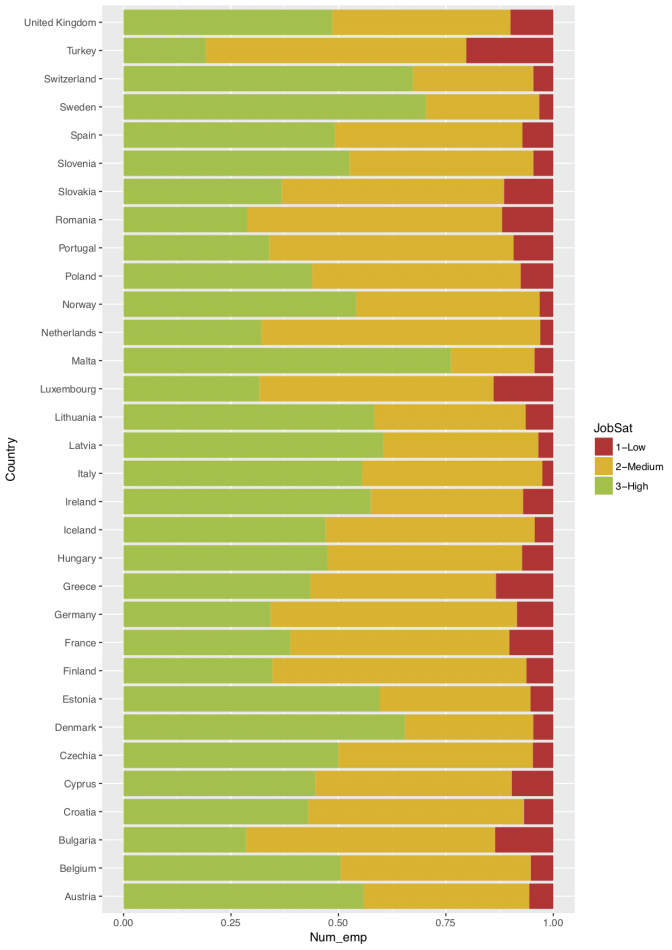
The unemployment rate in Malta was about 4.1% in 2017. In the UK, it was 4.4%. Not much difference. But look at the stark differences in the proportion of people with high job satisfaction between the two countries. You might argue that Malta is small and too dissimilar to the UK, and this is a fair point. Sweden had an unemployment rate of about 6.4% in 2017 – much higher than either the UK or Malta – but average job satisfaction is still much higher. Meanwhile, according to the OECD, Sweden has a mean life satisfaction of 7.3 out of 10. The OECD average is 6.5, and the UK is at 6.7. This may seem small, but is a huge difference when you consider it’s the mean of a very large population sample.
Quality adjusted employment?
If just putting people into employment is not the answer, maybe we need to measure something more useful than the mere number of people employed or unemployed. Health economics uses the Quality Adjusted Life Year to measure the benefits accrued to a person after some sort of health intervention. The basic idea is that just saying you will live three years longer after having a surgery, for example, doesn’t tell you what your life is going to be like over those three years. They might be so miserable that you’d rather not bother with the surgery. In principle, it’s not so difficult to compute something similar for employment. A Quality Adjusted Employment measure could take into account things like job satisfaction, working hours, and pay, in order to generate a weight for each worker from 0 to 1 that represents the so called ‘quality’ of their employment.
What this would achieve is to reduce focus on the proportion of people working as a proxy for how well a country is ‘running’ at any given time. As an example, suppose there are two countries: A and B. Both countries have a potential labour force of 100 people. Country A has 98 people working and 2 people unemployed. The unemployment rate is therefore 2%. However, suppose all of those 98 people are working in a job that has a quality of 0.5. The quality adjusted employment would be 0.5 x 98 = 49. Alternatively, you could see it as a quality adjusted unemployment of 51%. On the other hand, 90 out of 100 people in Country B are working, but all 90 of them have a job quality of 0.7. Country B has an actual unemployment rate of 10%. Based on headline figures, this suggests that B is ‘worse off’ in some respects than A. However, the quality adjusted employment of Country B is 90 x 0.7 = 63, i.e. a quality adjusted unemployment rate of 37%. Thus it could be possible for a country to have a much larger unemployment rate, but still have the employed population in better situations.
Of course, this is an exaggerated example, and one would still need to think about how unemployed people are supported, both financially and socially. However, at the same time, I think it is lacking in utility to focus solely on employment and unemployment statistics in terms of gross number. This is especially true when the overall proportion in employment is relatively close to 1. In the same way that governments have started to embrace subjective measures of well-being, maybe it’s also time for them to look at a new and more realistic way of how much benefit being in employment actually brings. In the longer term, we need to look at reducing how much people have to work anyway, but that’s another story for another day.