
People have been trying to categorise others into different personality types for thousands of years. Hippocrates described four fundamental temperaments (sanguine, choleric, melancholic, phlegmatic) that were thought to be induced by a difference in balance of bodily fluids. Since then, a plethora of other typing systems have been devised, such as the commonly used ‘Myers-Briggs’ system (MBTI). This applies theory based on the work of Carl Jung to create 16 personality types.
Meanwhile, more contemporary psychology, which adheres more closely to the scientific method, has tried to measure personality traits in individuals based on the idea that they are a set of interconnected continuous variables. This has culminated into the now well-known Big Five factors of personality: Agreeableness, Conscientiousness, Extraversion, Neuroticism (or emotional stability), and Openness (or intellect).
A recent study published in Nature Human Behaviour by Gerlach et al. has attempted to bring personality traits and personality types together. Using some rather sophisticated statistical methods applied to a large amount of Big Five data, their evidence seems to point to four meaningful clusters of Big Five factors. They call these four types Average (the most common), Self-centred, Reserved, and Role Model. What is important, however, is this method is somewhat inductive in nature. It uses the data to find common patterns in trait combinations, which it then clusters together. This is somewhat different to more classical typology systems, which use theoretical underpinnings to generate classifications, and then try to fit people into these classifications.
Neither approach is more correct than the other. However, sticking to a classification system based on a theory that fits the data poorly is just as bad as creating a ‘perfect’ classification solely from one set of data, which cannot be generalised because there is no theoretical underpinning for these types. The optimal approach generally involves using observations to form a more comprehensive general theory, which can then be tested on multiple datasets to see if it can be falsified. If not, then there are good grounds to stick with it for practical purposes.
243 types?
Here is a slightly different approach that I’ve had in mind for a while. The data have shown that the Big Five traits are pretty reliable, in the sense that they seem to emerge naturally in a bunch of different datasets. So let’s assume that these are the five main traits that we need to consider. Each of these traits is measured on a continuum, and in general, the data seem to result in a single-peaked distribution. Let’s use some real data to see this. The British Household Panel Survey measured the Big Five in 2005, and this is what the distribution of trait scores looks like (n = 7482):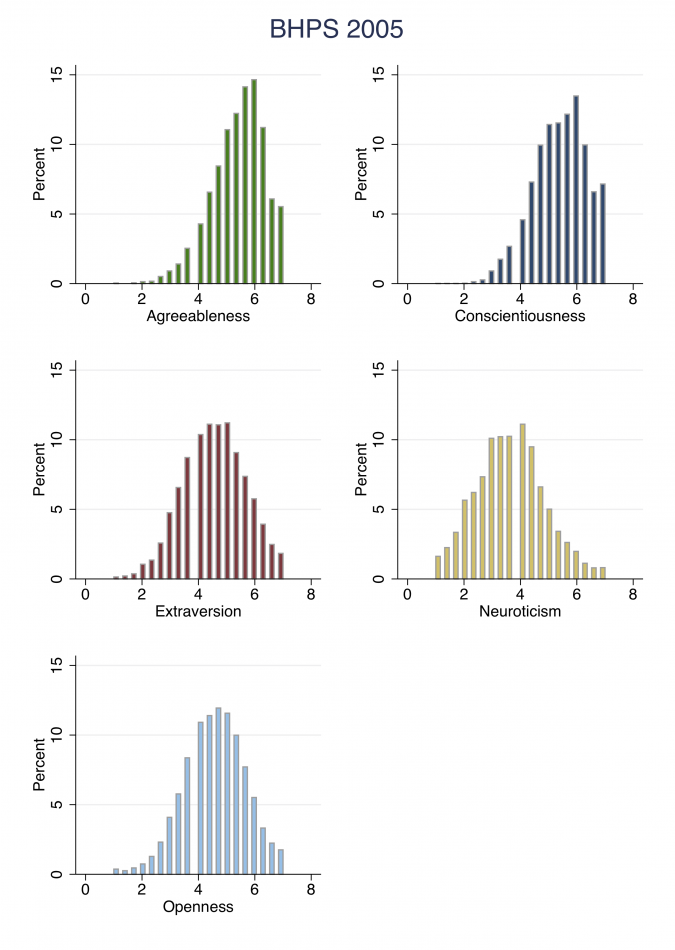 A lot of previous personality typing theories seem to enforce a binary relationship or trade-off. For example, you are either an extravert or an introvert. But what does this really mean in practice? When we measure extraversion, it looks quite like a bell curve. If you were to split it right down the middle, you’d get some ‘introverts’ that are pretty much the same as ‘extraverts’ since their scores might lie on either side of the split point. Meanwhile, you would also get two ‘introverts’ that are almost nothing alike if one was at extreme end of the distribution, and the other was towards the middle.
Therefore, because of the unimodal hump shape of these distributions, I propose that we might be better off cutting each trait into three. The bulk of people would fit into the ‘normal’ category, but there would also be ‘low’ and ‘high’ categories for each trait. There are two ways of coming up with the split points: absolute, and relative. Absolute cut-offs would be fixed numerical values for every trait. Since in the present case, each trait is measured from 1 to 7, this would involve, for example, assigning everyone with a score less than 2.5 as ‘low’ for a trait. Relative cut-offs would be different for each trait, and based on the data itself.
There are advantages and disadvantages for both methods, and I won’t go into them in detail here. For the purpose of this short article, I want to create categories that have a fixed interpretation. Therefore, I set absolute thresholds that are defined as low if the trait score is between 1 and 2.5, mid if the trait score is between 2.5 and 5.5 (inclusive), and high if the trait score is higher than 5.5. Since there are five traits, and three values for each trait, this means there are 3^5 = 243 different personality ‘types’.
Results
The top 25 types cover 85% of the sample, and are listed in the table below.
| A | C | E | N | O | % | Cumulative |
| Mid | Mid | Mid | Mid | Mid | 18.26 | 18.26 |
| High | High | Mid | Mid | Mid | 11.88 | 30.14 |
| High | Mid | Mid | Mid | Mid | 9.08 | 39.22 |
| Mid | High | Mid | Mid | Mid | 7.39 | 46.61 |
| High | High | Mid | Low | Mid | 3.42 | 50.03 |
| High | High | High | Mid | Mid | 3.35 | 53.38 |
| High | High | Mid | Mid | High | 3.07 | 56.45 |
| Mid | Mid | Mid | Low | Mid | 2.13 | 58.58 |
| High | Mid | High | Mid | Mid | 2.10 | 60.68 |
| High | Mid | Mid | Mid | High | 2.07 | 62.75 |
| Mid | Mid | High | Mid | Mid | 2.06 | 64.81 |
| Mid | Mid | Mid | Mid | High | 2.04 | 66.85 |
| Mid | High | Mid | Low | Mid | 1.99 | 68.84 |
| High | High | High | Mid | High | 1.90 | 70.74 |
| High | High | High | Low | Mid | 1.71 | 72.45 |
| Mid | High | High | Mid | Mid | 1.59 | 74.04 |
| High | High | Mid | Low | High | 1.56 | 75.6 |
| Mid | High | Mid | Mid | High | 1.55 | 77.15 |
| High | Mid | Mid | Low | Mid | 1.50 | 78.65 |
| High | High | Mid | High | Mid | 1.34 | 79.99 |
| High | High | High | Low | High | 1.28 | 81.27 |
| Mid | Mid | Mid | High | Mid | 1.18 | 82.45 |
| Mid | Mid | Mid | Mid | Low | 1.00 | 83.45 |
| High | Mid | Mid | High | Mid | 1.00 | 84.45 |
| High | Mid | High | Mid | High | 0.92 | 85.37 |
Unsurprisingly, the most common personality ‘type’ is where all traits are in the mid range. This constitutes 18% of the sample. The next most common type consists of people with high agreeableness and conscientiousness, but middle levels of other traits. What is a little surprising, at least to me, is that low-extraversion (i.e. introverted) types are quite uncommon. The first of these types is 28th on the list and only represents 0.12% of the sample. This type is highly conscientious and open, but low on extraversion. You may find other types that are interesting to you in the table.
The main take away message from all of this is that we probably can come up with more meaningful personality types that are likely to represent groups of individuals that are more closely matched. However, it’s not really clear how best to define the thresholds for which to enforce a particular classification. Indeed, if traits are truly continuous, then there may never be a ‘best’ way.
I, too, cosidered the “3^5 = 243 different personality ‘types’” idea and decided to Google it. Very illuminating ideas here. Thank you!
I came here from googling 3^5 personality types to see exactly this haha.
Here is the problem with this idea: that “243 personality types” is likely redundant when viewed through the lens of robustness. It is likely that in some cases the distinction between medium and extrema might be skewed towards one side or the other, rendering it equivalent to only having low and high. Also, it is good to consider “personality clusters” as an alternative to these dimensions, of which it is more likely there are less than 14 effective personality clusters that are clear cut.
https://www.nature.com/articles/s41562-018-0419-z